How to Trade with Trend Lines: A Beginner's Guide
Every trader seeks methods to forecast market movements. Trend lines can help filter out the “noise” in the forex markets, providing clarity on price trends.Trendline trading is versatile across various timeframes, making it a valuable addition to your forex trading strategy.Here’s an overview of how to effectively use trend lines and understand their nuances.
Maximum leverage 1:500
99.35% of orders achieve ultra-fast execution < 13ms
T+0 Speed Withdrawal
Tradable financial products 100+
What is a Trend Line?

Why Use Trend Lines?
Trading platforms like MetaTrader 4 enable you to manually draw trend lines or automatically connect the tops of candlestick or bar charts.

Helps visualize the market’s overall trend

Identifies levels of support and resistance

Clarifies the trend's direction

Allows for multiple trend lines to assess market volatility
How to Find and Draw Trend Lines
For effective forex trading, follow these steps to find and draw trend lines:
1. Open a clean chart without analysis or indicators.
2. Identify the highest price point on the chart.
3. Select the line drawing tool and drag it from this point to the chart’s end.
4. Adjust the line downward until it touches two or more highs.
The key is for the line to touch at least three points (including the origin). More points indicate a stronger trend line, but three points are the minimum.
How to Trade Trend Lines
Trend lines offer various trading opportunities. Here’s how to use them in different strategies:
Range Trading
In a well-established trend with parallel top and bottom lines, you can exploit the likelihood of the trend continuing.
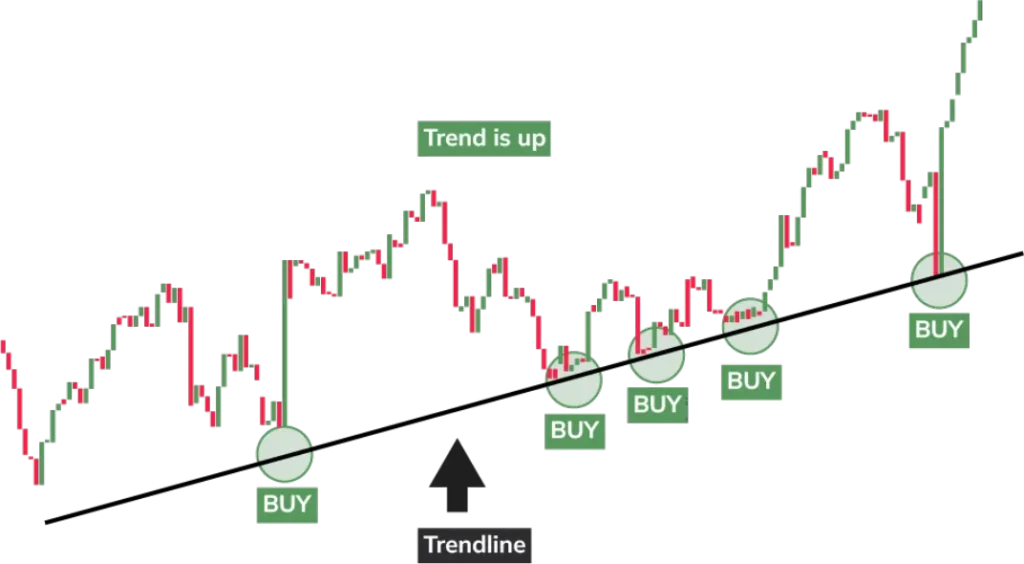
When the price nears the bottom trend line, look for bullish signals to open a long position, anticipating an upward move toward the top trend line.
Conversely, when the market approaches the upper trend line, look for bearish signals to open a short position, expecting a downward move toward the lower trend line.

Breakout Trading
Breakouts can be profitable when the market closes above the upper trend line or below the lower trend line, usually accompanied by increased trading volume.
Confirm the breakout by checking the trading volume during the breakout period. A breakout is often confirmed if the period’s bar or candle closes beyond the trend line.

A Caution for Traders
Markets are not linear; they often move in a jagged manner with periodic reversals. Finding a trend line does not guarantee that the market will follow that direction overall. The market may be moving counter to the trend line, indicating a potential consolidation within the main trend.


FREQUENTLY ASKED QUESTIONS
Trend lines are graphical tools used in technical analysis to identify the direction and strength of a trend by connecting significant highs or lows on a price chart. They help traders visualize trends and potential reversal points.
To draw a trend line:
Identify Key Points: Select at least two significant highs or lows on the chart.
Connect the Points: Draw a straight line that connects these key points. For an uptrend, connect the lows; for a downtrend, connect the highs.
Extend the Line: Extend the line to project future price movement and identify potential support or resistance levels.
The main types of trend lines are:
Uptrend Line: Drawn by connecting higher lows; indicates a bullish trend.
Downtrend Line: Drawn by connecting lower highs; indicates a bearish trend.
Horizontal Trend Line: Used to identify support or resistance levels in a range-bound market.
Trend lines help identify trends by:
Confirming Trends: An uptrend line indicates an ongoing bullish trend, while a downtrend line signals a bearish trend.
Indicating Reversals: A break of the trend line can signal a potential trend reversal or the end of the trend.
Providing Support/Resistance: Trend lines can act as support in an uptrend or resistance in a downtrend.
Common mistakes include:
Incorrect Placement: Not aligning trend lines with significant highs or lows.
Overextending Lines: Extending trend lines too far beyond relevant points.
Ignoring Confirmation: Relying solely on trend lines without considering other indicators or confirmation signals.
Adjusting Trend Lines Frequently: Continuously changing trend lines can lead to confusion and misinterpretation.
To confirm a trend line break:
Check Volume: A significant increase in volume can confirm the validity of the break.
Look for Close: Ensure the price closes beyond the trend line, not just a temporary breach.
Use Additional Indicators: Confirm with other technical indicators like moving averages, RSI, or MACD to validate the trend line break.
Trend lines can be combined with:
Moving Averages: To identify the overall trend and confirm trend line signals.
Relative Strength Index (RSI): To gauge the strength of the trend and potential overbought or oversold conditions.
MACD: To confirm trend direction and momentum.
Support and Resistance Levels: To identify key levels where trend lines intersect with support or resistance zones.
Trend line angles provide insights into the strength and speed of a trend:
Steep Angles: Indicate strong trends but may be prone to rapid reversals.
Shallow Angles: Suggest weaker trends and potential for gradual price movements.
Yes, trend lines can be used in any timeframe, from minutes to monthly charts. The significance of trend lines may vary with the timeframe, with longer timeframes generally providing stronger trend signals.
Trend lines can be drawn on various asset classes, including:
Stocks: Identify trends in stock price movements.
Forex: Analyze currency pairs and trend direction.
Commodities: Track trends in commodity prices.
Indices: Evaluate market indices and overall trends.
Trend line channels consist of two parallel trend lines:
Uptrend Channel: Contains an upper trend line (resistance) and a lower trend line (support).
Downtrend Channel: Contains a lower trend line (support) and an upper trend line (resistance).
Usage: Channels help identify potential buy or sell zones and the strength of the trend within the channel.
Risk management strategies include:
Setting Stop-Loss Orders: Place stop-loss orders below support in an uptrend or above resistance in a downtrend to limit potential losses.
Using Position Sizing: Adjust the size of trades based on the trend line's significance and risk tolerance.
Monitoring Trend Strength: Use additional indicators to confirm trend strength and reduce the risk of false signals.
Trend lines should be adjusted:
When Significant Price Changes Occur: Modify trend lines if significant price movements or new highs/lows affect the trend.
Regularly Review: Periodically review trend lines to ensure they align with current market conditions and trends.
Benefits of using trend lines include:
Visual Clarity: Provides a clear visual representation of trend direction and potential reversal points.
Trend Identification: Helps identify and confirm ongoing trends.
Support/Resistance Levels: Assists in identifying key support and resistance levels.
Additional resources include:
Educational Webinars: Participate in webinars focused on trend line analysis and trading strategies.
Trading Books: Read books and guides on technical analysis and trend lines.
Online Tutorials: Explore online tutorials and articles for detailed explanations and examples.
Trading Forums: Join trading communities to discuss trend lines and share experiences with other traders.


